Comment: Comparison of microseismic results from the Bakken Formation processed by three different c
- Jan 15, 2018
- 5 min read
The paper in the link provided was published in 2011 and is an often cited or referenced in both client meetings and when others have ulterior motives - such as trying to promote surface microseismic monitoring vs downhole. The objection I have with the paper is on the the omission of critically important QC materials that would support each vendor's processing. Also missing from the paper and often not discussed are processing details, pitfalls, or ambiguities which are inherent in all forms of geophysical processing (but differ with technique).
In this blog, I will first repeat the methods and results (shown in the gallery below) before I get into the missing QC materials and processing details associated with borehole seismic processing.
Refresher on Vendor Methods:
Company 1: Processed the wells independently in realtime, using PS picking. Permitting prohibited Company 1 from being able to merge the data in realtime. Oriented via stringshots, built a dipping model based on provided logs and calibrated it so the ball seats and early events located near the expected location.
Company 2: Merged the wells, could not see the P waves that company 1 did (filter?) and then used the S-waves to triangulate the positioning.
Company 3: Had the advantage of processing the data after realtime and merging the data, used PS picking and also had another advantage of having a VSP analysis for modeling comparison.
Refresher on Vendor Results:
Company 1: The results were as expected by the engineering team. The fracture propagated upwards, there was limited lateral extension.
Company 2: Fewer overall events, more events located below the wellbore than Company 1, horizontal plane of events.
Company 3: Even depth distribution centered around the wellbore. Events follow a curvature anomaly observed in the surface seismic to some degree. Would have advised in adding more geophones to the array.
Pitfalls for Processing
180° Ambiguity
What we know about downhole processing is that there is a 180° ambiguity when recording an event from a single array, in other words there are two possible solutions. Often times when the monitor well is next to the wellbore, the events can be observed to propagate towards the monitoring well and then sometimes past it. A geophysicist must use care in locating events here as while they can move past the monitor well. The processor can use the previous stages half-lengths as a guide and may flip events to locate near the stage. There is more confidence when monitor well is offset from the treating lateral and/or the direction of SHmax and the treatment does not directly hit the monitor well.
Velocity Modeling
Often in velocity modeling of perforation events the processor will locate the calibration shots perfectly along the wellbore at the correct depth. Once the events are applied, they also locate perfectly along the same depth or stacking out along a velocity contrast. Care must be maintained when velocity modeling to reduce these (weighted averaging, smoothing, adding more layers to step between large velocity layers) and a solid understanding of the location methodology and event picking (direct waves picked vs refracted waves).
Missing QC Materials: When looking at the event distribution of the 3 providers it is apparent there is a large discrepancy in the overall project results which are most prominent in the map and depth views. This could be more accurately located with dual arrays (providing for a good velocity model and orientations of each array). However, the merging of two arrays does not mean that each array will be contributing to the location of the event. Missing from this report is the number of co-located events being identified from individual array events.
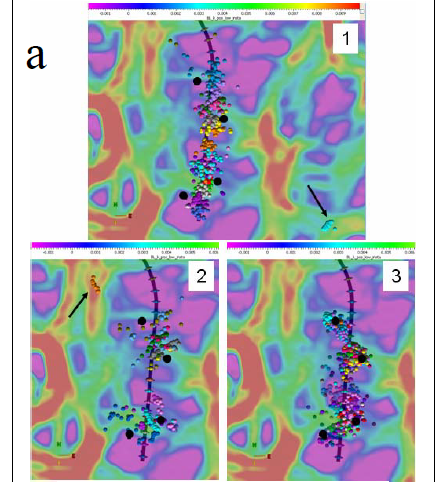
Comment: Map View:
Company 1 has the events located along the wellbore with an even distribution orthogonal to the wellbore. The stage overlap in map view is mostly occurring above the lateral. Stages 6-9 appear to cluster in a similar location above the lateral and is isolated from stage 5 and 10.
Company 2 has events from the first stage, that locate approximately 1000 feet to the west of stage 5. If those events were flipped 180° with respect to the closest monitoring well (assuming that location was used) then the events would center over the stage 1 sleeve.
Company 3 also has zero events from the first two stages locating near their respective sleeves. There is also an oscillating pattern in the events which the authors presume is related to an anomaly in their seismic curvature but more likely this is a result of the observation well bias. Additionally, there is little to no stage isolation which would indicate the packers failure. Stage 10 appears to have treated heelward of the stage 12 sleeve, and then the subsequent stages all overlapped. Lastly, though it is believed that the Bakken/3-Forks has a small variation between the horizontal stresses, there is still a linear trend observed by Company 1 for several stages and no such trend is observed by the other vendors.
Missing QC Materials: Calibration points, string shots, ball seats and/or early events and the velocity models used, number of orientations used (per monitor well) and if the co-location improved the event location by showing the calibration points being located by each array and together.
Comment Depth View:
Company 1 has a more predictable distribution of events based on what we know of the Bakken/3Forks- the frac propagates up. While the events are isolated at depth, suggesting the packers were able to isolate each treatment, as the frac migrated up, there was some overlap and clustering. Regardless of the depth of the geophone array, there is a consistency in the event depth distribution.
Company 2 has what appears to be some shallow artifact or boundary where events cannot pass. There are more events below the lateral in the early stages and almost zero below the lateral in the heelward stages. This would suggest a significant change in the geologic properties. No clustering is observed in the lower events (typical of faulting). The distribution of events appears to be correlated with the depth of the geophone array.
Company 3 has what appears to be an artifact within the model where events stack along yet event can pass through. The events seem to center around the lateral which is typical for some fields, but atypical for the Bakken/3Forks. There is little stage isolation and the events seem to cluster around the observation well. The distribution of the events matches the depth of the geophone array.
Missing QC Materials: With the first pair geophones arrays straddling the lateral and the second pair located above the lateral the addition of waveform moveouts (seismograms) would clearly demonstrate which provider was correct in the event depth distribution. Examples of shallow, ball seat, and deep events would definitively establish the correct depth distribution.
Additional Comment: An evaluation of the completions curves could also be of value with respect to the stage overlap and suggested leaking packers by two of the providers (Company 2 and 3).
Conclusion:
The authors made a conclusion where the state of the processing is too unreliable to be of value. I believe this was incorrect. While much missing from the paper but it appears that based on my processing experience and familiarity with the play, that Company 1's results are more likely correct. The other two providers lacked the experience or software flexibility to accurately locate the microseisms. This paper demonstrates why it is key for operators to have more familiarity with the techniques by adding a senior level microseismic processor to their organization.


Comments